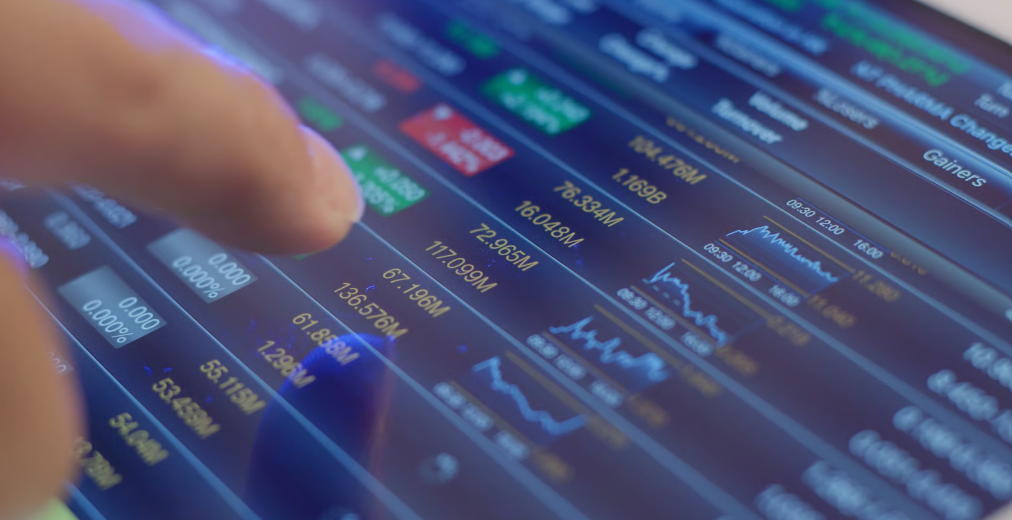
A stock ticker symbol is a short code, usually one to five letters, that identifies a publicly traded security on an exchange and lets traders, investors, brokers, data providers, and news platforms refer to the same asset without confusion. If you have ever typed AAPL into a charting platform, searched NVDA on a broker app, or watched CNBC flash MSFT across the screen, you have already used ticker symbols as the basic language of the market. They look simple, but they carry practical meaning, and understanding that meaning helps you move faster, avoid costly errors, and narrow in on the right trade.
In day-to-day market work, the ticker symbol is the entry point to almost everything. It pulls up the price chart, the order book, company filings, options chain, earnings history, analyst coverage, and institutional ownership data. It also connects a trade idea to a real instrument. That distinction matters because many companies have similar names, some securities trade on multiple venues, and one brand can have common shares, preferred shares, bonds, ETFs, ADRs, and options all tied to different identifiers. The ticker is not just a label. It is the operational key that opens the exact market you want to analyze.
For retail traders, this matters because speed and precision influence results. A valid setup on the wrong symbol is still a bad trade. I have seen traders pull up the wrong share class, enter an order in an illiquid foreign listing, or confuse an ETF with a single stock simply because they relied on a company name instead of confirming the symbol. In volatile conditions, that kind of mistake can widen spreads, create slippage, distort risk calculations, and invalidate the thesis before the trade even starts. A strong process begins with clean symbol identification.
To use ticker symbols well, you need to know three related terms. First, the ticker symbol is the exchange-facing shorthand such as TSLA or AMZN. Second, the company name is the legal or brand name associated with the issuer. Third, the CUSIP, ISIN, or SEDOL are formal security identifiers used in settlement, custody, or international databases. Traders usually work from the ticker because it is the fastest practical reference, but serious analysis often involves cross-checking the exact instrument behind it. That habit becomes even more important when you trade around earnings, corporate actions, or sector rotation.
How stock ticker symbols work in real market practice
Ticker symbols originated with telegraph tape systems that printed abbreviated company identifiers to save space and speed communication. The market kept the idea because it works. On the New York Stock Exchange, many older companies historically received one-, two-, or three-letter symbols, such as F for Ford and T for AT\&T. Nasdaq listings more often use four letters, such as ADBE, META, and NFLX, although that pattern is convention rather than a hard rule. Other exchanges use their own structures, suffixes, and conventions, especially outside the United States.
When you enter a symbol into a broker platform, the system maps that code to a specific listed instrument. That mapping usually includes exchange, quote currency, security type, and corporate metadata. For example, RDSA and RDSB once identified different Royal Dutch Shell share classes before the company simplified its structure and changed to SHEL. That kind of change is common enough that active traders should treat symbols as living identifiers, not permanent facts. Mergers, rebrandings, spin-offs, and exchange transfers can all alter what a ticker represents.
Suffixes and punctuation matter too. On many platforms, BRK.B identifies Berkshire Hathaway Class B shares, while BRK-A or BRK.A may represent the Class A shares depending on the data feed format. Canadian and UK listings often include exchange suffixes like .TO for Toronto or .L for London. ETFs, ADRs, REITs, and preferred shares may use naming structures that look similar to common stock, but behave very differently in terms of liquidity, taxation, and catalysts. If you do not verify the instrument behind the symbol, you are analyzing noise instead of opportunity.
The practical lesson is straightforward: a ticker symbol is a shortcut, not a substitute for due diligence. It gets you to the instrument quickly, but you still need to confirm what that instrument actually is. Before I evaluate any chart, I check the exchange, average daily volume, market cap, sector, and upcoming events tied to the symbol. That takes less than a minute and prevents a large share of avoidable mistakes. Good traders are not just fast; they are accurate first and fast second.
Why ticker symbols matter when choosing the right trade
The right trade is never just about finding a chart that looks strong or weak. It is about matching a market view with the correct vehicle. Ticker symbols help you do that by making the screening process precise. If your thesis is rising cloud spending, you might compare MSFT, AMZN, GOOGL, and an ETF like IGV rather than vaguely searching “tech stocks.” If your thesis is falling regional bank sentiment after a credit scare, you may choose KRE for basket exposure or a single-bank symbol if the setup is company-specific. The ticker turns an idea into a tradable expression.
This precision also affects risk. A trader who wants diversified semiconductor exposure might be better served by SOXX or SMH than by a single-name symbol like AMD or NVDA, especially if earnings risk is near. On the other hand, if the setup depends on company-specific momentum after a product launch or guidance revision, a broad ETF can dilute the edge. Ticker symbols let you compare those options cleanly because each symbol points to a different risk profile, catalyst map, and liquidity structure.
Liquidity is one of the biggest practical filters. Two symbols may belong to similar businesses, but one can trade tens of millions of shares per day while the other barely trades at all. High liquidity generally means tighter bid-ask spreads, more reliable fills, and cleaner technical levels. Lower liquidity often means larger spreads, weaker price discovery, and greater vulnerability to headline spikes. When I review symbols for swing trades, I pay close attention to average dollar volume, not just share volume, because a $5 stock and a $500 stock can show the same share turnover with very different execution quality.
Tickers also matter because news, data, and sentiment are organized around them. Earnings beats, SEC filings, insider transactions, options flow, analyst upgrades, and short interest all map back to a symbol. If you are using a scanner, watchlist, or research terminal, the ticker is how those data streams combine into a decision. A clean workflow begins by identifying the right symbols, then ranking them by trend, catalyst, relative strength, and liquidity. Without that structure, trade selection becomes random and reactive.
How to use a ticker symbol to research a trade setup
The most effective way to use a ticker symbol is to treat it as the first step in a repeatable research process. Start by entering the symbol in a charting platform such as TradingView, Thinkorswim, Interactive Brokers, or TrendSpider. Confirm the exchange and instrument type. Then review the daily and weekly chart to determine the primary trend, key support and resistance, moving averages, and recent volatility. I usually begin with the 20-day, 50-day, and 200-day moving averages because they quickly show whether the symbol is trending, basing, or deteriorating.
Next, pull the core fundamental and event data tied to the symbol. Check market capitalization, earnings date, revenue growth, profit margins, debt levels, and valuation metrics if the trade horizon extends beyond a few days. For shorter-term trades, the earnings calendar, guidance history, and analyst revisions often matter more than deep valuation work. You should also inspect the options chain if options activity is influencing price. Elevated implied volatility ahead of earnings, for example, changes both opportunity and risk, even if the chart looks attractive.
Relative strength is another critical layer. Compare the symbol against its sector ETF and the broader index. If a stock is breaking out while its sector is flat, that suggests company-specific strength. If the whole sector is moving together, the trade may be macro-driven. That distinction affects position sizing and trade management. In my own process, I routinely compare symbols to SPY, QQQ, IWM, and the relevant industry ETF because leading stocks usually reveal themselves through outperformance before the crowd fully notices.
| Research step | What to check | Why it matters |
|---|---|---|
| Symbol verification | Exchange, security type, share class | Prevents trading the wrong instrument |
| Trend review | Daily and weekly chart, moving averages | Shows whether momentum supports the setup |
| Liquidity test | Average volume, dollar volume, spread | Improves execution quality and reduces slippage |
| Catalyst review | Earnings, filings, guidance, economic events | Identifies what could move price next |
| Relative strength | Performance versus sector and index | Helps find leadership and avoid laggards |
| Risk mapping | Support, resistance, ATR, stop distance | Defines position size and trade viability |
Finally, translate the symbol research into a trade plan. Define entry, invalidation, target, holding period, and position size before placing an order. A ticker symbol should lead you to a thesis, not a hunch. If you cannot explain why this symbol is better than the next-best alternative in the same theme, you probably do not have enough edge yet. Good trade selection is comparative. The symbol helps you narrow the field, but disciplined planning determines whether the opportunity is worth taking.
Common ticker symbol mistakes traders make
The most common mistake is assuming the company name is enough. It is not. Searching “Alphabet” instead of confirming GOOGL versus GOOG can matter if you care about voting rights or platform-specific data. Similar issues arise with dual-listed shares, foreign ADRs, and preferred securities. Another frequent error is ignoring exchange suffixes on international names. A symbol on the home exchange may trade with deep liquidity, while the over-the-counter version can be thin and erratic. The chart may look similar, but execution can be dramatically worse.
Another mistake is trading a symbol without checking for upcoming catalysts. A technically clean setup can fail instantly if earnings are due tomorrow, an FDA decision is pending, or an ex-dividend adjustment changes the tape. Corporate actions also create confusion. Reverse splits, ticker changes after mergers, and spin-offs can distort charts and historical data if your platform has not normalized them correctly. I always verify recent news and the corporate calendar before acting on a chart, especially in small caps where structural changes are more common.
Many traders also misuse ticker symbols by stopping at recognition instead of understanding. Knowing that XLF is a financial sector ETF or that TLT tracks long-dated Treasuries is useful, but it is only the beginning. You still need to know what drives those instruments, how they correlate with rates or credit spreads, and when they tend to move. The symbol is the front door. Edge comes from what you do after opening it. That is why serious traders build watchlists with notes, not just strings of familiar codes.
Best practices for building a ticker-based watchlist
A strong watchlist should be organized by purpose rather than popularity. I recommend keeping separate groups for index ETFs, sector ETFs, current leaders, potential reversals, earnings setups, and high-liquidity stocks you understand well. Symbols like SPY, QQQ, IWM, DIA, XLF, XLK, XLE, and SMH provide a macro framework. Single names then fit beneath that framework. This makes it easier to see whether strength is broad, sector-specific, or isolated. It also reduces emotional chasing because you are comparing prepared candidates instead of reacting to random headlines.
Update the watchlist weekly. Remove symbols that lose liquidity, break their structure, or no longer fit your strategy. Add symbols showing improving relative strength, clean trend development, or fresh catalysts. If you publish or follow weekly market research, this routine is especially valuable because it forces consistency. Over time, you will notice that the best trades often come from a small number of repeat symbols that move cleanly and respond predictably to catalysts. Familiarity does not guarantee profits, but it improves pattern recognition and execution quality.
The main benefit of understanding stock ticker symbols is simple: they help you connect a market idea to the exact instrument that best expresses it. A ticker symbol identifies the security, unlocks the chart and data, and lets you compare alternatives with precision. Used properly, it reduces confusion, improves research, and leads to better trade selection. Used casually, it can send you into the wrong asset, the wrong liquidity profile, or the wrong risk event.
Remember the practical sequence. Verify the symbol and instrument type first. Review trend, liquidity, and catalysts second. Compare the symbol to its sector and index third. Then build a trade plan with defined entry, exit, and risk. That process is not complicated, but it is disciplined, and discipline is what separates clean execution from preventable mistakes. In my experience, traders improve quickly when they stop treating symbols as mere labels and start treating them as research anchors.
If you want to find the right trade more consistently, start with a better watchlist and a stricter symbol verification routine. Study a small group of high-quality ticker symbols each week, track how they respond to earnings and macro news, and refine your process from there. The market offers endless noise, but the right symbol, matched to the right thesis, gives you a clear place to begin.
Frequently Asked Questions
What is a stock ticker symbol, and why does it matter when trading or investing?
A stock ticker symbol is a short series of letters used to identify a publicly traded security on a specific exchange. In most cases, it is between one and five characters and acts like the market’s shorthand for a company, fund, or other listed asset. For example, AAPL refers to Apple, MSFT refers to Microsoft, and NVDA refers to Nvidia. Instead of typing a full company name every time you want to look up a chart, place an order, read earnings news, or compare performance, the ticker symbol gives you one standardized code that platforms, brokers, exchanges, and financial media all recognize.
It matters because accuracy is essential in trading and investing. Many companies have similar names, and some operate in the same industry, which can create confusion if you rely only on the company name. The ticker symbol helps you pull up the correct chart, the correct options chain, the correct financial statements, and the correct news flow. It is also the fastest way to move through a trading platform, especially if you are screening stocks, monitoring watchlists, or reacting to market news in real time.
In practical terms, the ticker symbol is the entry point to almost everything you do in the market. It is how you search for a stock, verify the asset you are analyzing, and avoid costly mistakes caused by selecting the wrong security. Even though ticker symbols look simple, they are one of the most important tools for identifying and trading the right asset with confidence.
How do you use a ticker symbol to find the right trade?
You use a ticker symbol as the starting point for research, trade execution, and risk management. The first step is to enter the symbol into your broker, charting software, scanner, or financial news platform. That pulls up the specific security you want to evaluate. Once you have the correct asset on screen, you can review its current price, volume, chart pattern, recent news, earnings calendar, analyst coverage, volatility, and broader trend. Without the correct ticker symbol, none of that analysis is reliable.
From there, the symbol helps you narrow down whether the opportunity actually fits your strategy. A day trader may use the ticker to check intraday momentum, liquidity, spreads, and premarket activity. A swing trader may focus on trend structure, support and resistance, and upcoming catalysts. A long-term investor may use the same symbol to review revenue growth, balance sheet quality, valuation, and competitive position. The ticker itself does not tell you whether the trade is good, but it gets you to the exact data set you need to make an informed decision.
It also plays a major role when placing the actual order. Before you buy or sell, you should verify that the ticker matches the company name, exchange, order type, and share class you intended to trade. This is especially important with stocks that have multiple share classes or similar-sounding names. In other words, using the ticker symbol correctly means more than typing it into a search box. It means using that code to confirm identity, analyze the right security, and execute the trade you actually want rather than the one you selected by mistake.
Can two different companies have similar ticker symbols, and how can you avoid confusion?
Yes, ticker symbols can be very similar, and that is one reason traders and investors need to be careful. A single letter difference can point to a completely different company, sector, exchange, or even type of security. In fast-moving markets, that kind of confusion can lead to poor analysis or, worse, an unintended trade. Similar names can make the problem even more common, especially when companies operate in related industries or have branding that sounds alike.
The best way to avoid confusion is to use the ticker symbol together with other identifying details. Always confirm the full company name, the exchange where it is listed, and the current price before placing an order. Many broker platforms also display the company logo, asset type, and market cap, which can give you one more layer of confirmation. If you are trading an ETF, ADR, preferred share, or a company with multiple share classes, double-check that you selected the exact instrument you meant to trade.
It is also smart to slow down when entering orders manually. Do not assume that the first search result is automatically the right one. Review the quote page, make sure the chart and company profile align with your research, and confirm that any news headlines or filings you are reading belong to that security. This habit is especially important when volatility is high and speed matters. A few extra seconds of verification can protect you from a very expensive mistake.
Do ticker symbols tell you anything about the stock itself?
Sometimes they do, but not always in a way that replaces real research. In many cases, a ticker symbol is simply a recognizable abbreviation chosen to represent the company or fund. For example, some symbols clearly reflect the company name, while others are more creative or historical. On their own, ticker symbols usually do not provide deep insight into fundamentals, valuation, or trade quality. They are identifiers first, not full descriptions.
That said, certain naming conventions can give you useful clues. On some exchanges, the length of the symbol or added suffixes may indicate the type of listing, share class, or corporate status. In some markets, special endings can signal foreign listings, bankruptcy status, or other specific conditions. Different exchanges also use different formats, so context matters. The symbol can hint at what you are looking at, but you should never rely on the symbol alone to understand the security.
The real value is in what the ticker unlocks. Once you enter it into your trading or research platform, you can access the information that does matter: price action, earnings history, fundamentals, ownership data, options activity, and news catalysts. Think of the ticker as the label on the file, not the contents of the file itself. It helps you open the right folder, but you still need to study what is inside before making a trading or investing decision.
What should beginners check after entering a ticker symbol into a broker or charting platform?
Beginners should treat ticker verification as a checklist, not a quick glance. After entering a symbol, the first thing to confirm is the full company or fund name. Make sure it matches the asset you intended to research or trade. Next, check the exchange, current price, and chart to ensure they make sense based on what you already know. If you expected a large-cap technology stock and the platform pulls up a thinly traded microcap on a different exchange, that is a clear sign something is wrong.
After identity is confirmed, look at the basics that affect trade quality. Review average trading volume, bid-ask spread, recent price trend, and any major news or earnings announcements. Liquidity matters because it affects how easily you can enter and exit the trade. Volatility matters because it changes your risk. News matters because a stock can behave very differently around earnings, guidance changes, product launches, analyst upgrades, or regulatory developments. These checks help beginners move beyond simply finding a stock to evaluating whether it is actually tradable for their style and risk tolerance.
Finally, before placing an order, confirm the asset type and the exact order details. Make sure you are trading the common stock and not accidentally selecting options, warrants, preferred shares, or another related instrument. Review whether you are placing a market order or limit order, how many shares you are buying or selling, and what your exit plan is if the trade goes against you. For beginners, this step is crucial. A ticker symbol gets you to the right quote page, but disciplined review is what turns that symbol into a smart, controlled trading decision.